Monitor Tool
The Monitor Tool provides real-time tracking of individual attendee connections to better diagnose any technical issues within the webcast. These insights will help organizers adjust content delivery to give the audience the best viewing experience.
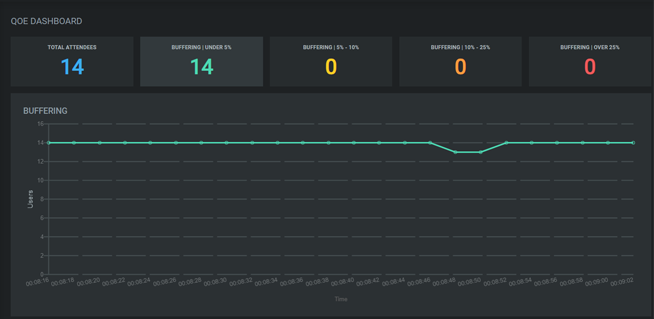
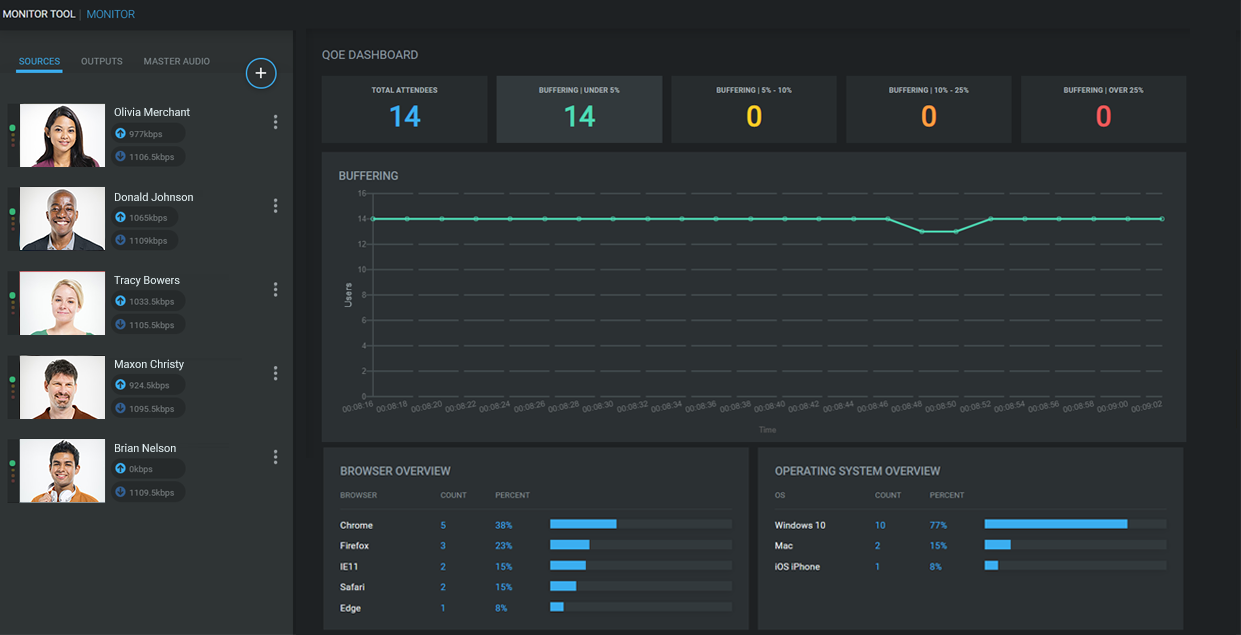
QoE Dashboard
The QoE Dashboard displays a real-time breakdown of the “health” (overall connectivity and streaming success) of your attendees over the span of your live webcast. This graph breaks down the audience into 4 buffering categories and colors:
- Buffering | Under 5% (green)
- Buffering | 5% - 10% (yellow)
- Buffering | 10% - 25% (orange)
- Buffering | Over 25% (red)
The connection is calculated based on the amount of buffering a connection is experiencing over the last minute of streaming.
Clicking on the number of attendees within a buffering categoring will open a detailed listing of that buffering group of attendees.
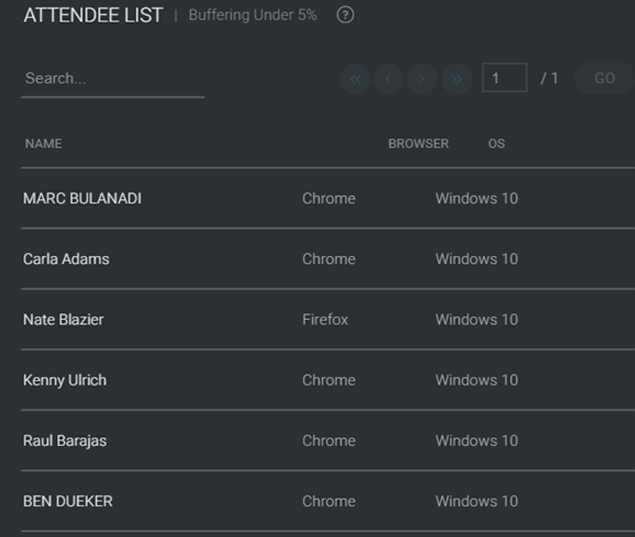
Attendee List
An attendee’s “health” rating is identified by the buffering category they fall into as either Good, Fair, Poor or Bad, based on their relative connection success to the webcast.
An Attendee List is generated for each health rating after clicking on the category. This list is a snapshot of the moment and provides the following attendee details:
- Name (as it appears on the user’s profile)
- OS
- Browser

Attendee User Detail
Drilling further into an attendee brings up the Attendee User Detail view, which provides diagnostic information at a granular level for the attendee’s current connection session.
| Name | Based on profile settings. |
| Based on profile settings. | |
| Last Ping | Represents the last time the user’s browser communicated to the Monitor Tool. |
| Browser | The browser the attendee used to connect to the webcast. |
| OS | The operating system the attendee used to connect tot the webcast. |
| Public IP Address | The attendee's external IP address as recognized by the platform. |
| *Internal IP Address | This is the attendee's internal IP address, as identified by the Amplify server on the customer's network. |
| *Amplify Server | The name of the Amplify server the attendee is retrieving media from. |
| Byte Count | The volume of content measured in MB or GB that was delivered to the attendee during the current connection session. |
* The above items marked with an asterisk are only applicable when using Amplify
Additionally, all the events that have occurred for this connection are displayed along the right-hand side. This gives a detailed view into all events a specific connection has experienced. The types of events that are displayed are:
- Buffering
- Adaptations
- HTTP Errors
- HTTP Errors
Attendee Connectivity Graphs
The QoE Dashboard generates a series of graphs that give a visual breakdown of the diagnostic information for the webcast attendees.
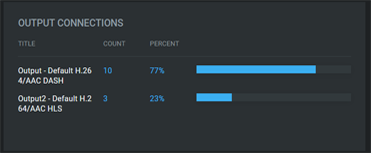
Output ConnectionsThe breakdown of attendees connected via DASH or HLS streams. Chrome, Firefox, Edge, Safari and Android devices connect via DASH. IE11 and iOS devices connect via HLS.
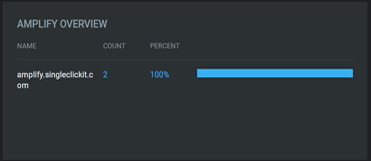
CDN OverviewThe breakdown of attendees connected to each CDN stream. If Amplify is being used in your webcast, those servers will also be displayed in the graph.
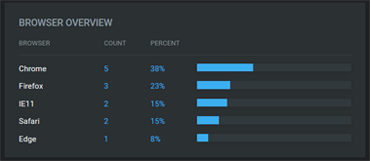
Browser OverviewThe breakdown of the browser usage for the attendees.
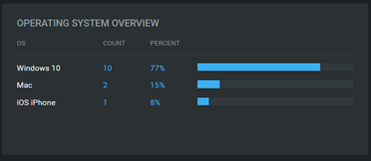
Operating System OverviewThe breakdown of the operating system usage for attendees.